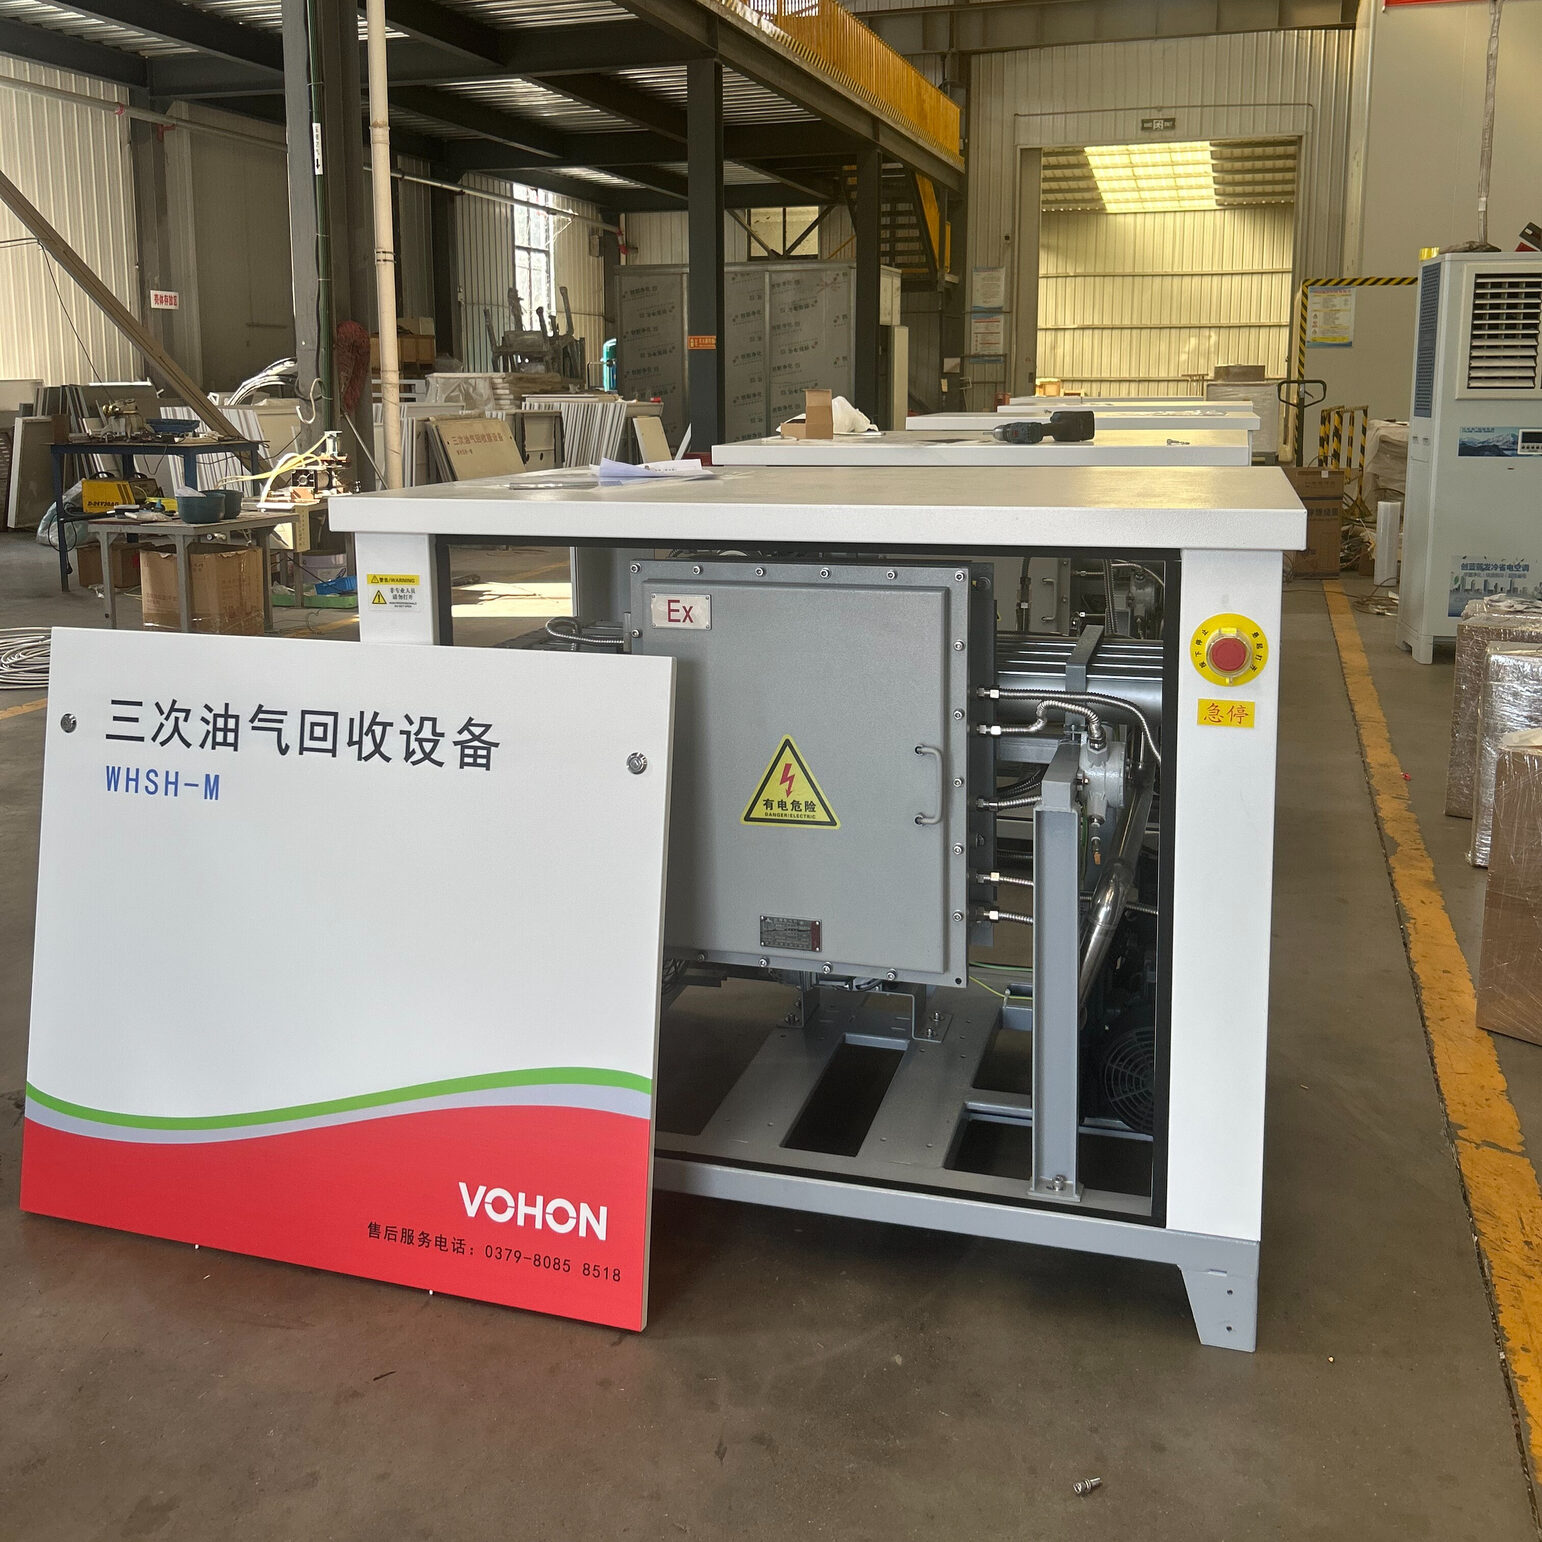
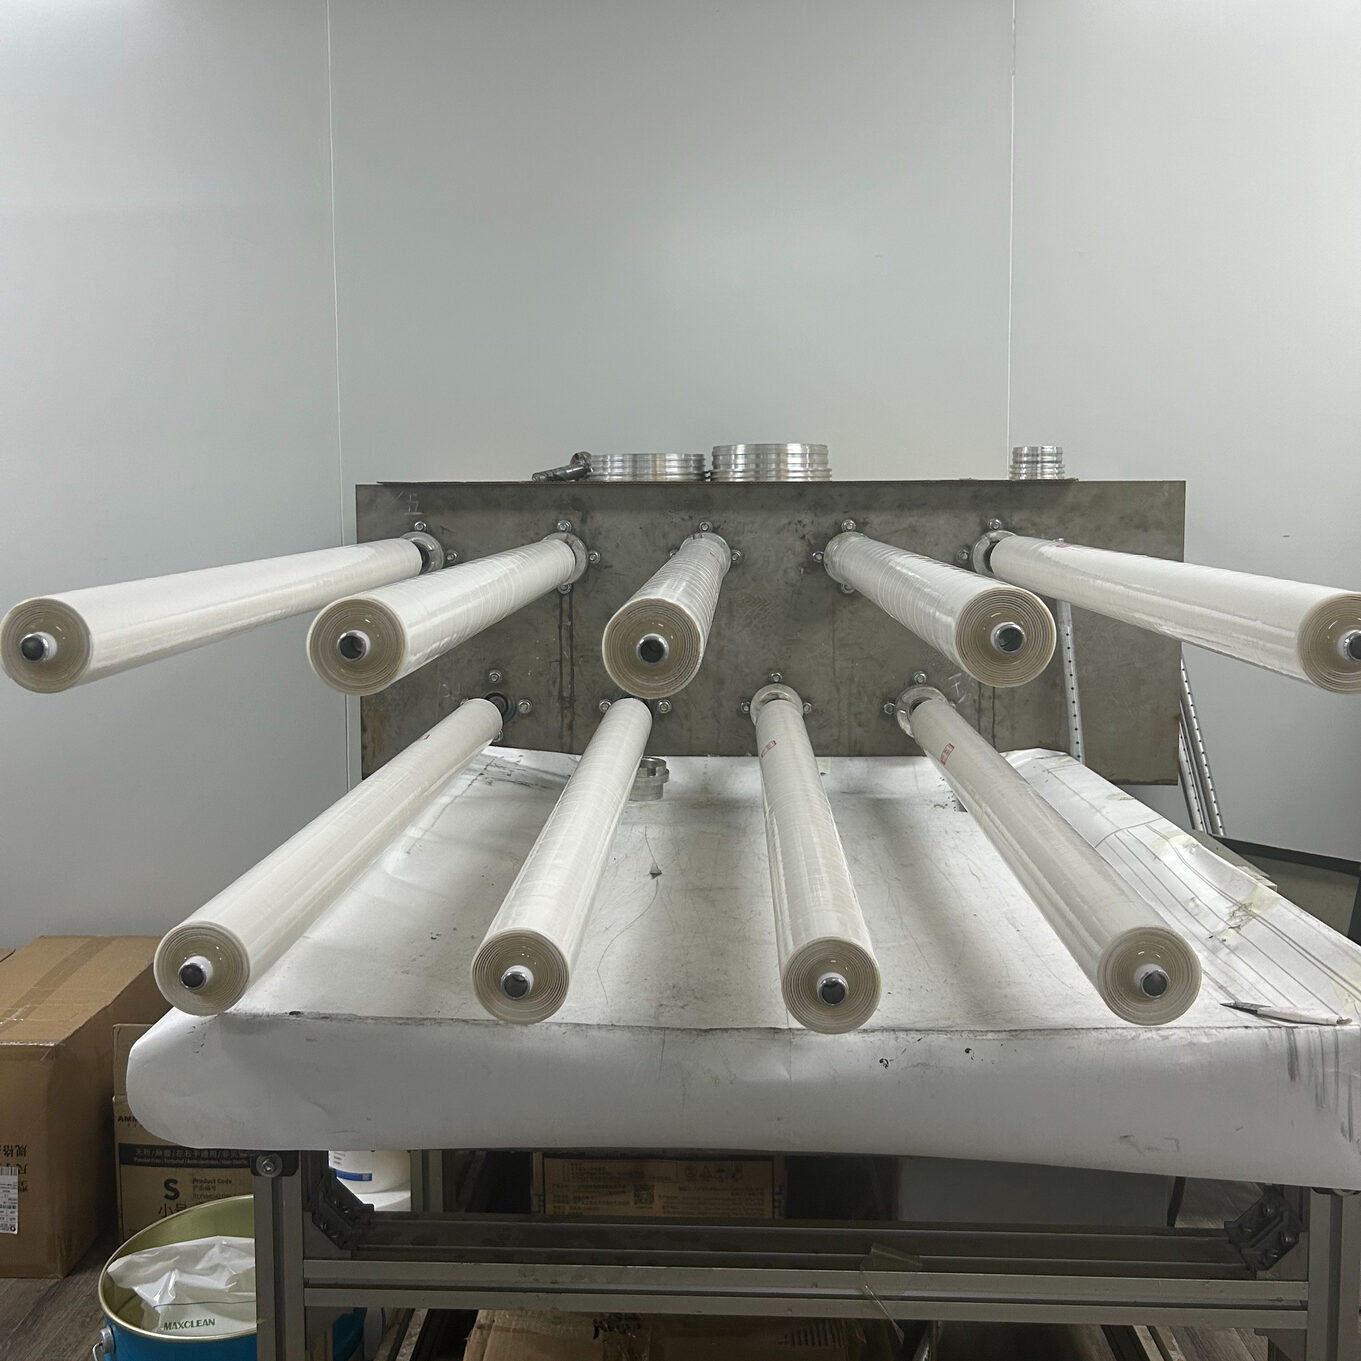
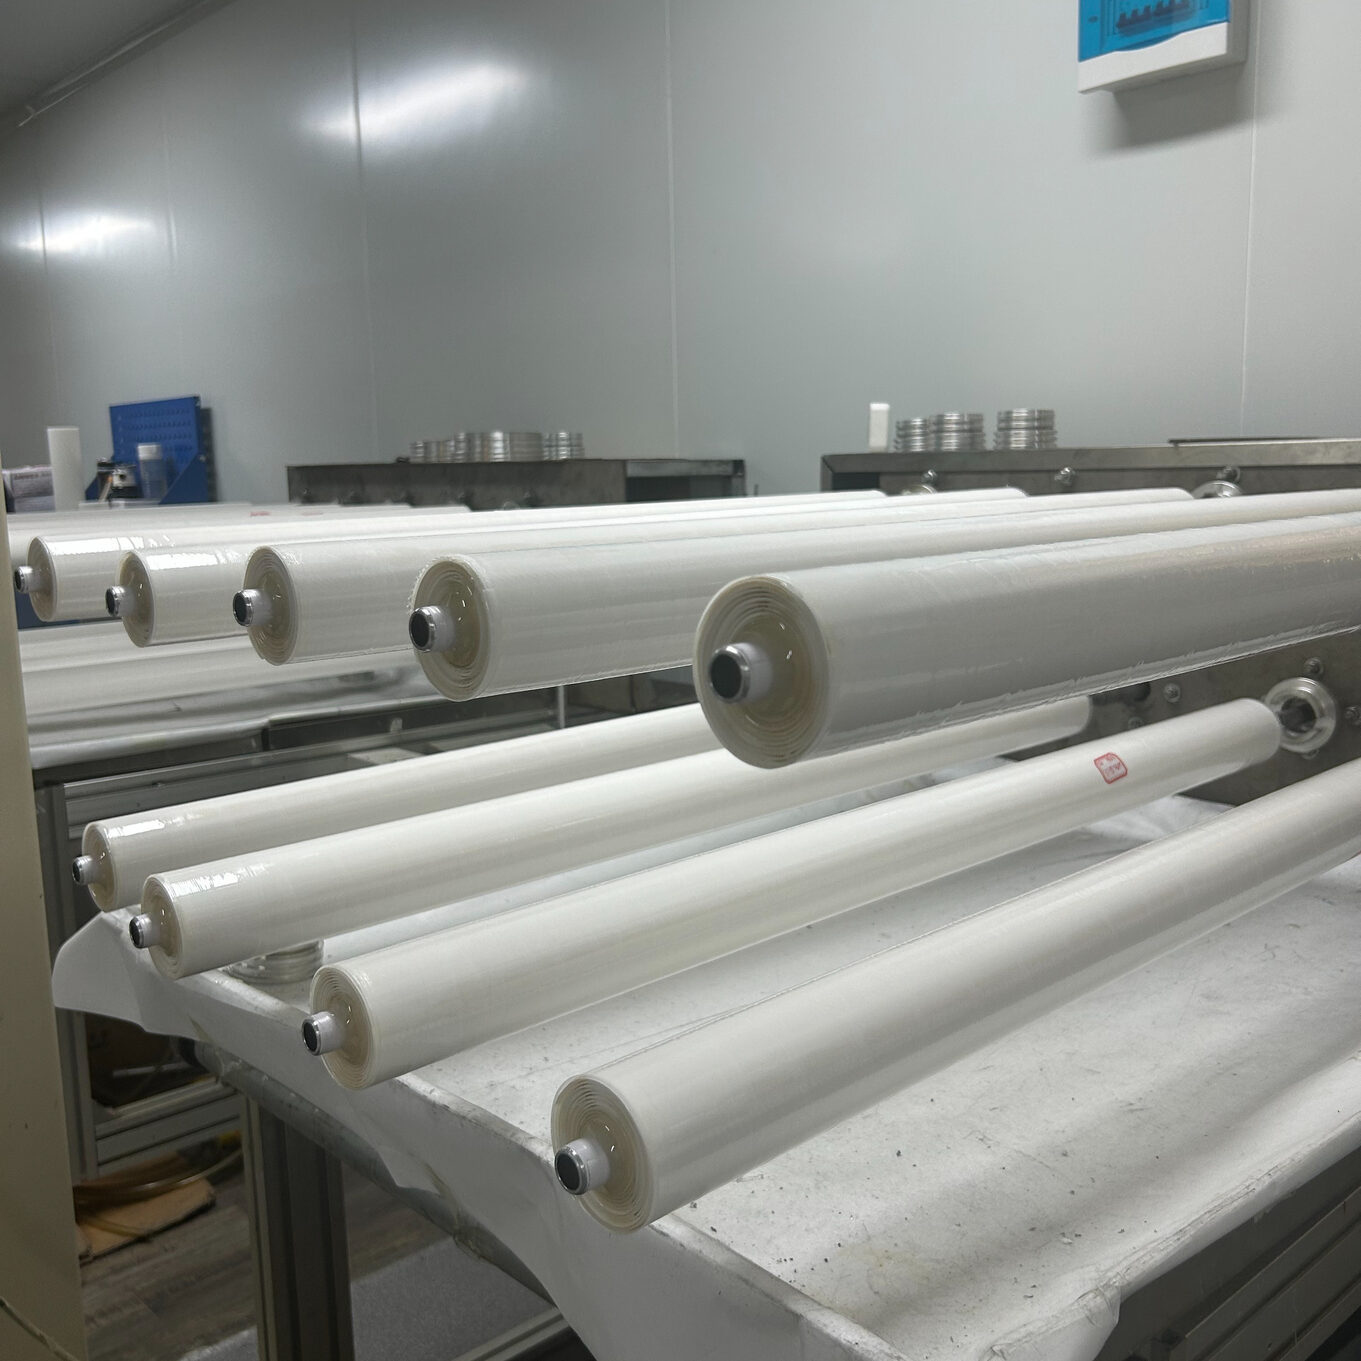
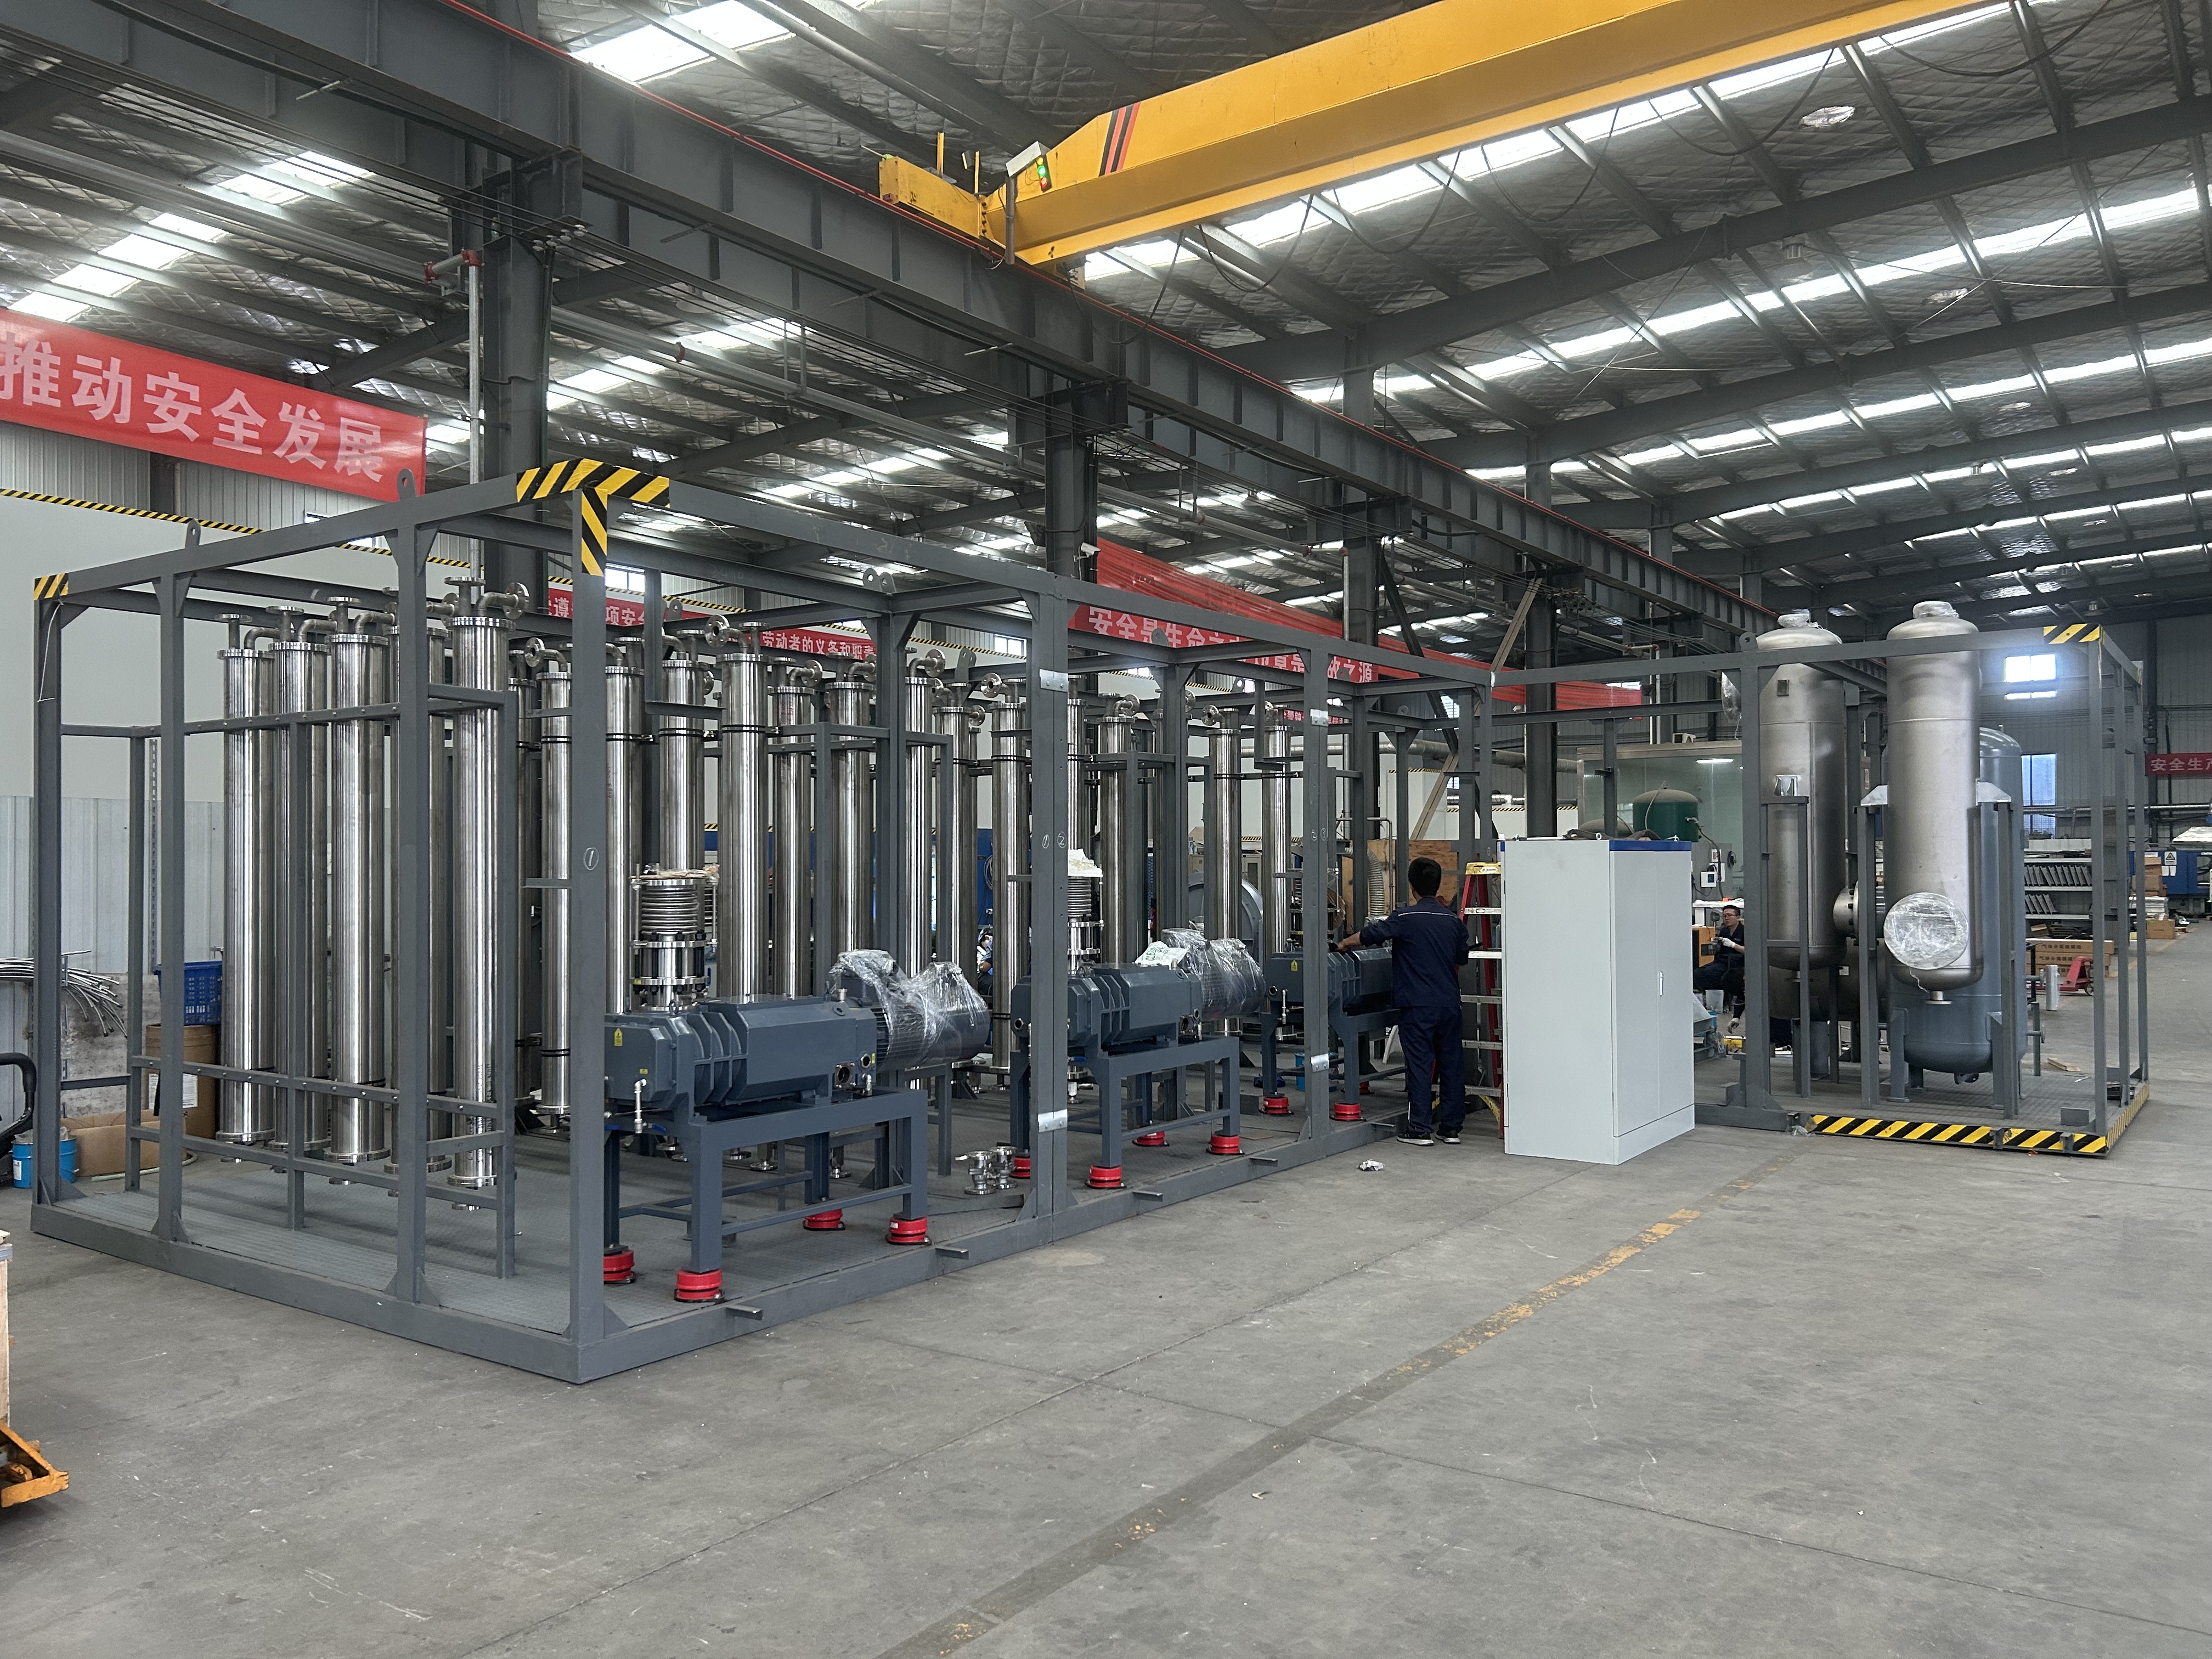
How to do online monitoring of organic vapor recovery membrane components? Direct answer: Focus on three sets of leading indicators - permeate side pressure, permeate gas flux, and pressure difference on both sides of the membrane. Draw a trend chart of the three and use inflection points instead of single point values to determine whether to clean or replace the membrane. The value of monitoring is to turn passive repair into active prediction: in the early stage of membrane fouling, the flux first decreases and the pressure difference then increases, and the trend line provides a signal much earlier than the alarm. Judging criteria: If the flux decreases by 20% compared to the baseline and the pressure difference continues to rise, cleaning should be arranged; The cleaning and recovery range gradually decreases, and a replacement plan is made accordingly. This article clarifies the monitoring items and predictive maintenance logic.
Membrane separation is driven by the pressure difference on both sides. Once the fouling layer is formed, the pressure on the permeate side first increases and the flux first decreases, which reflect the membrane state earlier than the discharge concentration. A common misconception on site is to only focus on meeting emission standards and wait for concentration alarms before taking action, often missing the optimal cleaning window and leading to irreversible pollution. Incorporating the parameters of the permeation side into continuous recording is a small investment to replace early warning: the cost of sensors and transmitters is not high, saving money on unplanned shutdowns and whole membrane replacement.
Core three items: permeate side pressure reflects membrane channel resistance, flux reflects actual recovery capacity, and pressure difference reflects pollution and blockage degree. Matching records of intake concentration, temperature, and vacuum degree are used to eliminate seasonal interference - high intake temperatures in summer can change separation selectivity. When comparing trends, the temperature should be corrected to avoid mistaking seasonal fluctuations for membrane faults. The instrument itself also needs to be checked, and zero drift of the transmitter will cause trend distortion. Key measuring points should be regularly compared.
The baseline is extracted from the stable section during the initial operation or after cleaning, and serves as the benchmark for all subsequent comparisons. For sites without historical baselines, starting from the stable operation data of this round, supplementary construction will be carried out, and the average of two to four consecutive weeks will be taken as a temporary baseline. The baseline is not fixed: after process adjustment and medium replacement, the segments are taken again to avoid using the old baseline to set new operating conditions. After the baseline is established, the trend chart is updated every time the data is updated, and the deviation direction is clear at a glance.
Maintenance graded by trend: slight decrease in flux and gradual increase in pressure difference, first check the pre-treatment and operating conditions; Reduce by 20% or if the pressure difference continues to deviate from the upper limit, arrange for cleaning and retesting to restore the amplitude; The recovery decreases after two consecutive cleaning cycles, and the replacement plan is pushed forward. The replacement prediction does not rely on a fixed period of time, but on the recovery amplitude and trend performance. Spare parts should be prepared in advance during the shutdown window to avoid forced shutdown. Integrating trend data into the operation and maintenance ledger allows for continuous judgment across shifts.
| Monitoring Items | normal trend | Abnormal signal | Priority Action |
|---|---|---|---|
| osmotic side pressure | Surrounding the baseline | Continuous upward trend | Check for pollution blockage |
| Flux | Stable baseline | Continued downward | Synchronize pressure difference check |
| differential pressure | stable | Ladder rise | Pre processing check |
| Intake air temperature | Design within | seasonal deviation | Revise and compare again |
| Vacuum degree | Stability | Wave attenuation | Check the vacuum system |
| Cleaning and Restoration | Close to baseline | successive decrement | By replacement plan |
Supplement construction from the current stable working condition: continuously record normal operating data for two to four weeks, and take the average of the stable segment as a temporary baseline; The earlier the follow-up trend judgment starts, the more reliable it is. It is much more realistic to repair while running than to go back and repair after a fault occurs.
First, eliminate false signals: intake concentration, vacuum degree, and instrument drift can all cause changes in readings; Take a look at the three items together and confirm that it is the trend of the membrane body before arranging cleaning to avoid ineffective shutdown and wasting windows.
Check the extent of cleaning recovery: After two consecutive cleaning cycles, the flux and pressure difference recovery significantly decreased, indicating irreversible pollution. Follow the replacement plan to proceed; Replacing the membrane over a fixed period of time may actually be too early or too late.
This article by LuoyangWohong PetrochemicalEquipment Co., Ltd. arranges that the company provides design, manufacturing and operation and maintenance services for condensation recovery, membrane separation recovery and complete solvent recovery devices for chemical and pharmaceutical enterprises. If you need process evaluation or scheme configuration, please contact and exchange.
Mr. Li 13526990215

Hotline